Rinky Dinky Minky
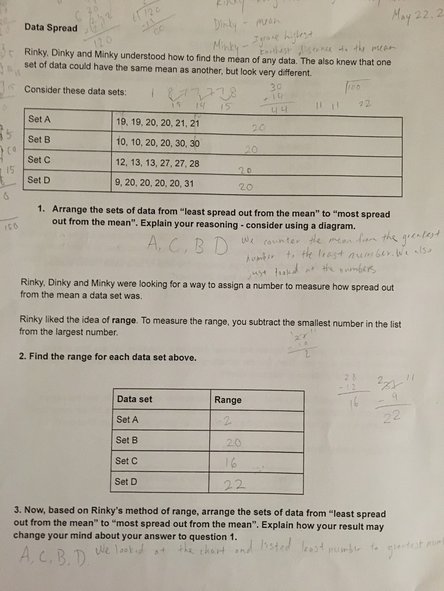
When doing this assignment I was given sets of data and I tried out different ways to see which way shows which data set is the least spread out. I calculated mean, range, and other ways as well.
Problem of the Week
Problems of the Week are these problems that were given one week to complete. When my class first receives a problem we work in groups then we get time to work in groups. That has made me more comfortable with working in groups.
Standard Deviation
When I first had to do this assignment I was unsure about how to calculate standard deviation on google spreadsheets. I gathered data, looked for frequency in the data, calculated standard deviation and also created graphs. At first it looked very complicated and I thought I would never understand it. I eventually asked questions and then got a better understanding of how to do it. It really reinforced that fact that if you are stuck on something, asking questions and trying again is a great way to further your understanding.
Click here for the Data, Standard Deviation, and Bar Graphs.
Click here for Standard Deviation Calculating spreadsheet
Click here for the Data, Standard Deviation, and Bar Graphs.
Click here for Standard Deviation Calculating spreadsheet
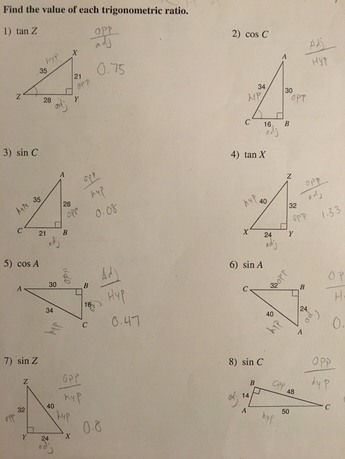
Trigonometry
When I first got introduced to trigonometry I was very difficult for me to understand how it worked for a long time I tried to figure it out one my own. I asked other classmates to explain and they explained in a way that made sense to me. Now I am able to do trigonometry.