Part 1 Overview
We started this project with playing Pig, a Renaissance dice game and recorded our scores. Then, we got all of scores and found the probability of getting the average score. We were expected to be able to find probability of an event's outcomes and made diagrams of it.
Probability is measure of the likelihood of a particular outcome for some event.
The Observed probability is the probability obtained by taking measurements (doing experiments or simulations)
The Theoretical Probability is the number of outcomes we are interested over the total number of possible outcomes.
Conditional Probability of an event is the probability that event B will happen given the knowledge that event A already happened, which can also be useful for writing out Joint Probability.
An example of Joint Probability is the probability of flipping a coin twice and getting two heads which is 1/4 because the outcome we want is the one outcome out of 4 possible equal outcomes. This can be can be written in mathematical notation as:
[Pr [2 Heads] - 4
The Marginal Probability is how frequent an outcome happens during an event . An example of this is when my class rolled die 25 times and recorded the results. We then put the data into one big chart and calculated the most frequent number.
A Two Way Table is a chart in which you fill in every box with a piece of data. The data aligns with the vertical and horizontal outsides of the chart which represents an outcome.
The Tree Diagram is similar because it does the same thing as a two way table except its different outcomes with its probability branching off into other outcomes with its own probability only connected by lines. Both are great ways to organize work.
Part 2: Your Renaissance-Inspired Game
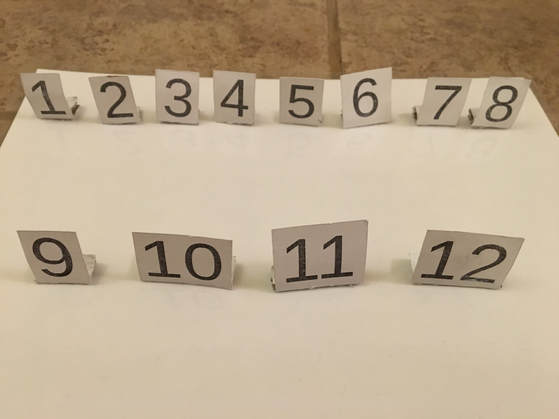
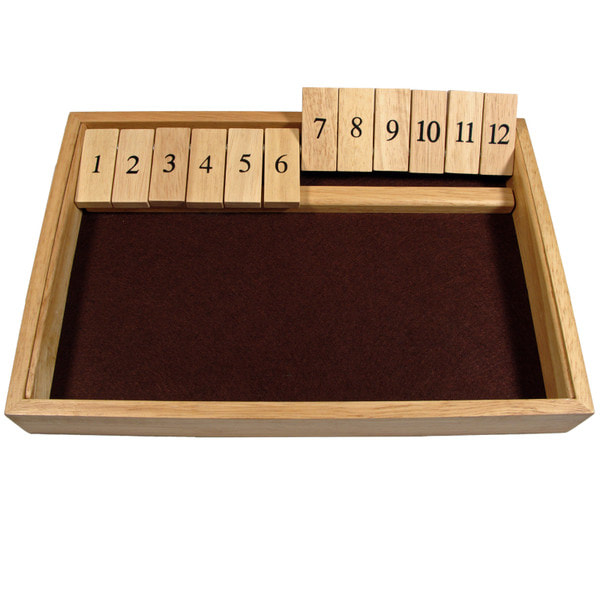
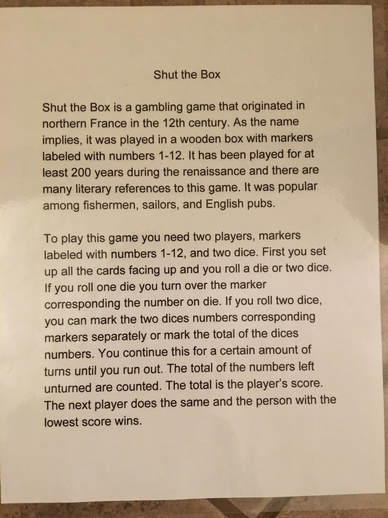
My game is called Shut The Box, a gambling game that originated in Northern France in the 12th century. It was played for at least two hundred years during the Renaissance and there are many literary references to this game. It was popular among fisherman, sailors and English pubs.
There are modern versions being sold on the internet and there are also articles on how to make them at home.
I chose this game because I never heard of it before and wanted to learn more about it.
To play this game you need two players, markers labeled with numbers 1-12, and two dice. First you set up all the cards facing up and you roll a die or two dice. If you roll one die you turn over the marker corresponding the number on die. If you roll two dice, you can mark the two dices numbers corresponding markers separately or mark the total of the dices numbers. You continue this for a certain amount of turns until you run out. The total of the numbers left unturned are counted. The total is the player’s score. The next player does the same and the person with the lowest score wins.
Probability plays a role in this game because its a dice game.
|
|
Part 3: Probability Analysis
What is the probability that I will get a sum of 12 each time I roll the die for my turn? (six rolls)
| shut_the_box_rules.pdf |
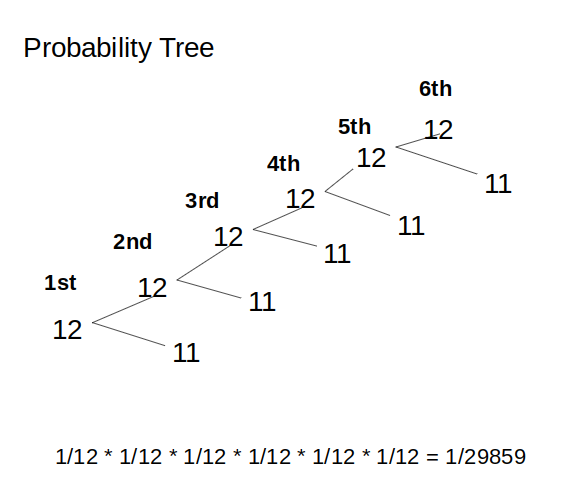
In this picture I created a tree diagram of the probability of rolling a 12 with two die and calculated the probability.
A Habit of Mathematician I used was stay organized because I made my probability tree digitally, which makes it neater and more easier to read.
A Habit of Mathematician I used was stay organized because I made my probability tree digitally, which makes it neater and more easier to read.
Part 4: Reflection
I thought that the project was good and it matched with the theme of our exhibition. I not only got to learn about probability but I also got to research the games the were played during the Renaissance. It interesting to see how different and similar the games they played back them are to the games we play today. Some were very similar and others were games I never heard of before. I enjoyed working on my games pieces and put a lot of effort into making the laminated rule sheet as clear as possible for exhibition. The two Habits of Mathematicians I used when working on the project were Describe and Articulate when I wrote out plans or my game pieces and Be Confident, Patient, and Persistent because despite never making a "board game" before I stayed confident in my abilities and kept persisting even when my original ideas didn't work.
